ChaseInTech Digest
Why Cost Per Task Matters More Than AI Token Pricing
AI token prices show the rate card, not the cost of completed work. Learn how to measure cost, time and reliability per verified AI task.
A cheaper input or output rate does not guarantee cheaper work. Retries, reasoning, tools, latency and human correction determine what a verified completion actually costs.
Every new AI model arrives with a pricing table.
Input tokens cost this much. Output tokens cost that much. Cached tokens are cheaper. Reasoning has its own line. Engineers can place the numbers in a spreadsheet and rank the models from cheapest to most expensive.
The problem is that nobody hires an AI system because they want tokens. They want completed work.
A coding agent needs to fix the bug. A research agent needs to find the evidence. A support agent needs to resolve the case. A browser agent needs to finish the workflow without breaking the account.
The cheapest token rate can still produce an expensive system if the model needs longer outputs, repeated attempts, more tool calls or a human to rescue the result.
That is why cost per verified task completion is usually the more useful operating metric.
Token price is a rate card
Token pricing still matters. It tells you how the provider will meter model consumption.
Input tokens cover the material sent to the model: the prompt, system instructions, files, retrieved documents, previous messages and tool results.
Output tokens cover what the model produces. Depending on the provider, that can include visible answer tokens and separate reasoning tokens.
Cached tokens are repeated input that the provider can reuse more cheaply. A low cache-hit price can matter in repository-scale coding or other workflows that repeatedly send a large stable context.
All of that is useful for estimating a bill. It does not tell you whether the system completed the task.
A low petrol price does not tell you the cost of a delivery if the driver takes the wrong route three times. In the same way, a low token price does not tell you the cost of useful AI work without knowing how much the system consumed and whether the result passed.
The Kimi K3 and Fable 5 example
Kimi K3 and Claude Fable 5 make the distinction easier to see.
Moonshot lists Kimi K3 at $0.30 per million cache-hit input tokens, $3 per million cache-miss input tokens and $15 per million output tokens.
Anthropic lists Claude Fable 5 at $10 per million standard input tokens, $1 per million cache hits and $50 per million output tokens. Cache writes have separate prices.
Looking only at those rate cards makes Kimi the obvious cheaper option.
But a fair operating comparison also needs task success, token usage, elapsed time and fallback behaviour.
Artificial Analysis runs Terminal-Bench v2.1 across 89 curated terminal tasks. The tasks cover software engineering, system administration, data processing, model training and security. Each task has a verification suite. The model does not receive credit because its answer sounds good. It has to leave the environment in the correct state.
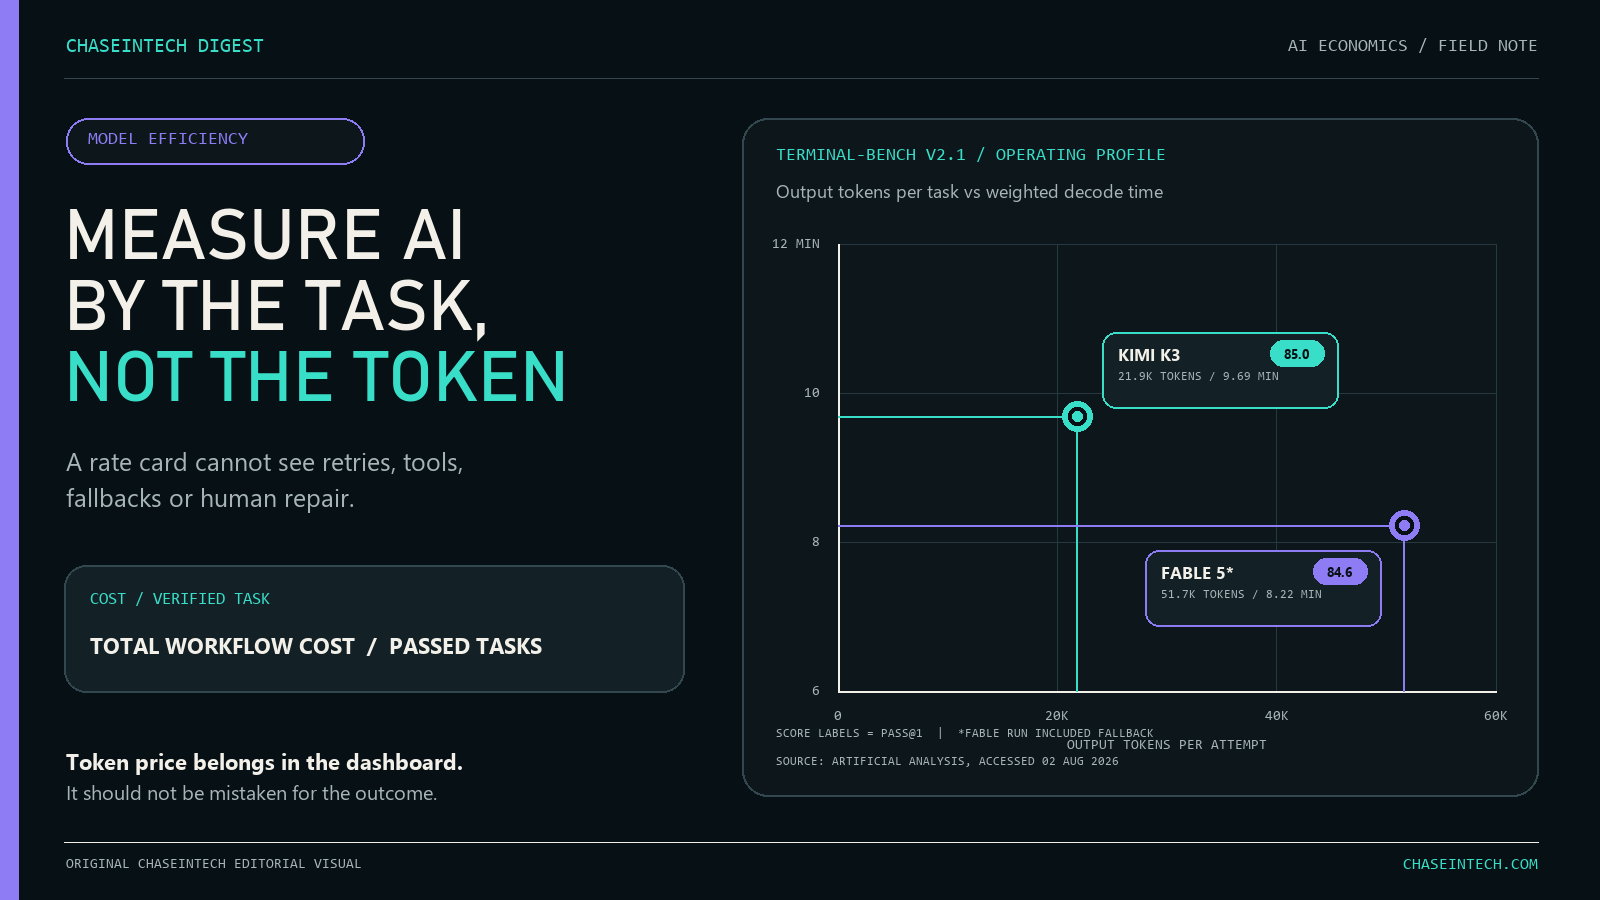
In the data available during this research, Kimi K3 and Fable 5 achieved similar task scores. Their operating profiles were different.
Kimi used fewer reported output and reasoning tokens per attempted task. Fable produced more output tokens but completed its weighted decoding sooner. Fable’s run also involved fallback behaviour, which makes attribution and exact cost accounting less clean.
That result corrects a tempting but unsupported version of the argument. This comparison does not show Kimi using more output tokens and losing its price advantage. It shows that token rate, token volume, speed and task success can move independently.
Kimi appears cheaper on the rate card and lighter on reported output-token use. Fable appears faster on weighted decode time. Their completion scores are close. The right choice depends on whether the workload is constrained by money, latency, reliability or something else.
Artificial Analysis publishes Kimi in its cost-per-task chart, but Fable is absent from the comparable cost dataset. Applying Fable’s list price mechanically to every reported token would create false precision because the fallback path is not cleanly attributed.
That missing number is part of the lesson. If the run cannot be attributed cleanly, the benchmark cannot support a clean cost-per-completion claim.
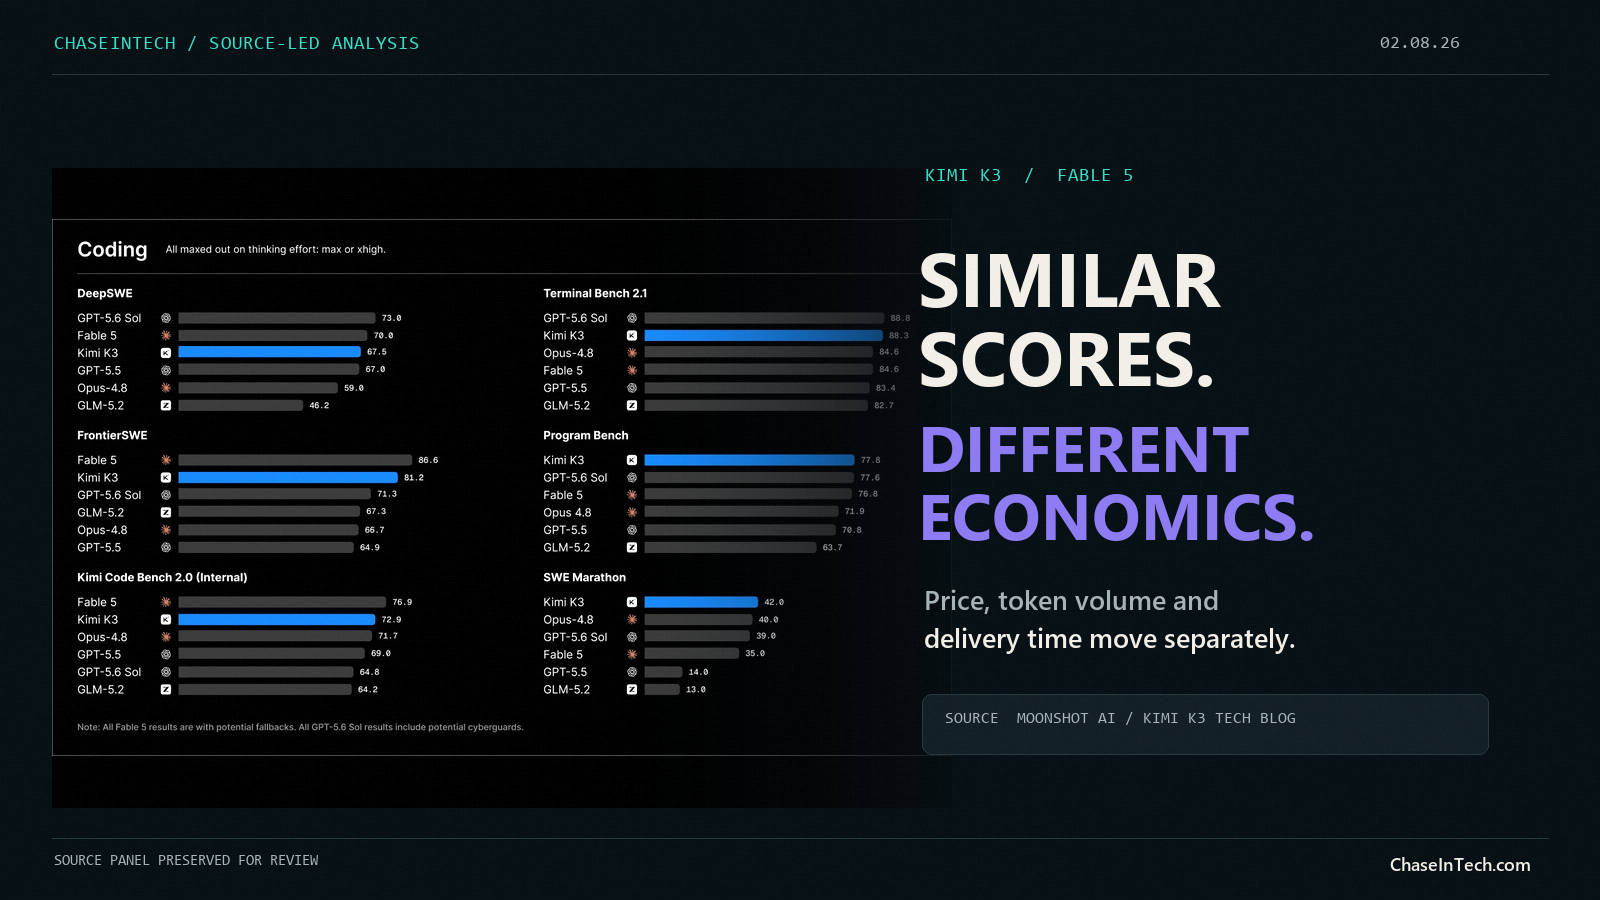
The comparison is useful because it separates score, output-token volume and delivery time. It is not a clean model-only cost comparison because the Fable run included fallback behaviour.
A cheap attempt is not a cheap completion
Suppose Model A costs half as much per attempt as Model B.
If Model A succeeds on the first attempt, it may be the better economic choice. If it fails twice, calls extra tools, falls back to Model B and then needs a developer to repair the patch, its lower token price did not produce the cheaper completion.
The distinction is simple:
Cost per attempted task =
  total workflow cost / all attempted tasks
That tells you the average cost of trying.
Cost per verified completion =
  total workflow cost / tasks that passed the acceptance gate
That tells you the average cost of receiving work you can actually accept.
The acceptance gate has to be defined before the test. For a coding task it might require the build to succeed, relevant tests to pass and no regression to appear. For research it might require every material claim to have a valid source. For customer support it might require the case to be resolved without breaching policy.
Without a gate, “completion” becomes whatever the model says it completed.
Research already treats cost and quality together
This is not only an editorial opinion.
FrugalGPT studied model cascades that route work across different language models. It reported matching the best individual model with up to 98 percent lower cost in its evaluated tasks, or improving GPT-4 accuracy at the same cost. The exact savings are historical and benchmark-specific, but the design principle is current: optimize cost and quality together.
RouteLLM studied learned routing between stronger and weaker models. It reported more than 2x cost reduction in some evaluations without sacrificing response quality. Again, that does not guarantee the same saving in every production system. It shows why model selection belongs on a cost-quality curve rather than a price-only leaderboard.
Tau-bench evaluates agents through the final state of the environment. It also measures repeated reliability. A system can sometimes succeed when given several chances while remaining unreliable across repeated real runs.
HumanEval’s pass@k metric demonstrates the other side. Generating many candidates can improve the chance that at least one works. That extra capability comes with additional generation and verification cost.
Anthropic’s engineering report on its multi-agent research system makes the system cost visible. Anthropic reported that agents used about four times as many tokens as chat interactions and multi-agent systems about fifteen times as many. It also found that token usage, tool calls and model choice all affected performance in its internal analysis.
The papers and engineering reports do not establish one universal cost-per-task number. They do support a wider conclusion: model efficiency has to connect cost with accepted outcomes.
What to include in the calculation
A serious cost-per-completion calculation should include more than model inference.
Cost per verified completion =
  model inference
  + tools and retrieval
  + retries and fallbacks
  + allocated infrastructure
  + human review and correction
  divided by verified completions
The model line should include input, output, cached and reasoning-token charges where the provider exposes them.
The system line should include paid search, browser infrastructure, vector databases, code sandboxes, storage and other services used by the workflow.
The failure line should include retries, timeouts and calls made before a fallback model finishes the task.
The human line should include review and correction time. A cheap agent that needs twenty minutes of senior engineering attention on every task may be more expensive than a costly model that produces an accepted result immediately.
Time needs its own column
Cost per completion should not swallow every other metric.
A slower but cheaper model may be a good choice for overnight research. It may be the wrong choice for an interactive coding assistant or customer support workflow.
Track time per verified completion separately:
- Median end-to-end completion time
- p95 completion time for slower cases
- Tool and network wait time
- Retry and fallback time
- Human review and repair time
Throughput matters too. A model can use fewer tokens but emit them slowly. Another model can produce more tokens at a higher speed. The Kimi and Fable data demonstrates this directly.
Do not replace one vanity metric with another
Cost per task is not an intrinsic property of a model.
It depends on:
- The task distribution
- The acceptance criteria
- The agent harness
- Available tools and permissions
- Prompt and context design
- Retry policy
- Evaluator quality
- Human review requirements
- Provider pricing at the time of the run
The harness is the software around the model. It controls which tools the model can call, how files are presented, how errors are returned and how many turns the agent receives. Comparing two models inside different harnesses partly compares two systems.
Evaluator quality matters as well. Research on LLM judges documents position, verbosity and self-enhancement biases. A cheap system can look efficient if its judge rewards confident prose instead of correct work.
That is why the result should be segmented by task type and difficulty rather than compressed into one universal leaderboard number.
The operating scorecard
Engineers evaluating models for real work should track:
- Input, output, cache and reasoning-token prices
- Tokens consumed per attempt
- First-attempt task success
- Final success after a fixed retry budget
- Tool calls and paid external services
- Cost per verified completion
- Time per verified completion
- Human correction minutes
- Fallback and timeout rates
- Failure severity
The rate card belongs in the scorecard. It should not be mistaken for the scorecard.
The builder takeaway
Token price tells you what one unit of model consumption costs.
Cost per verified completion tells you what accepted work costs.
Time per verified completion tells you how quickly that work arrives.
Teams should keep all three. Start with representative tasks, define the acceptance gate, hold the harness and retry budget constant, and measure the full workflow.
The model with the lowest input or output price may win. It may not. The point is to stop deciding before the work has been measured.
Tokens are consumption. Completed work is the product.
Read more practical AI systems research at https://chaseintech.com/articles
Follow ChaseInTech:
- Website: https://chaseintech.com
- RSS: https://chaseintech.com/rss.xml
- X: https://x.com/ChaserCrypto_
- LinkedIn: https://uk.linkedin.com/in/john-idowu-03044a175
- YouTube: https://www.youtube.com/@ChaseDNDT
- TikTok: https://www.tiktok.com/@chaseintech_
- GitHub: https://github.com/chasedndt
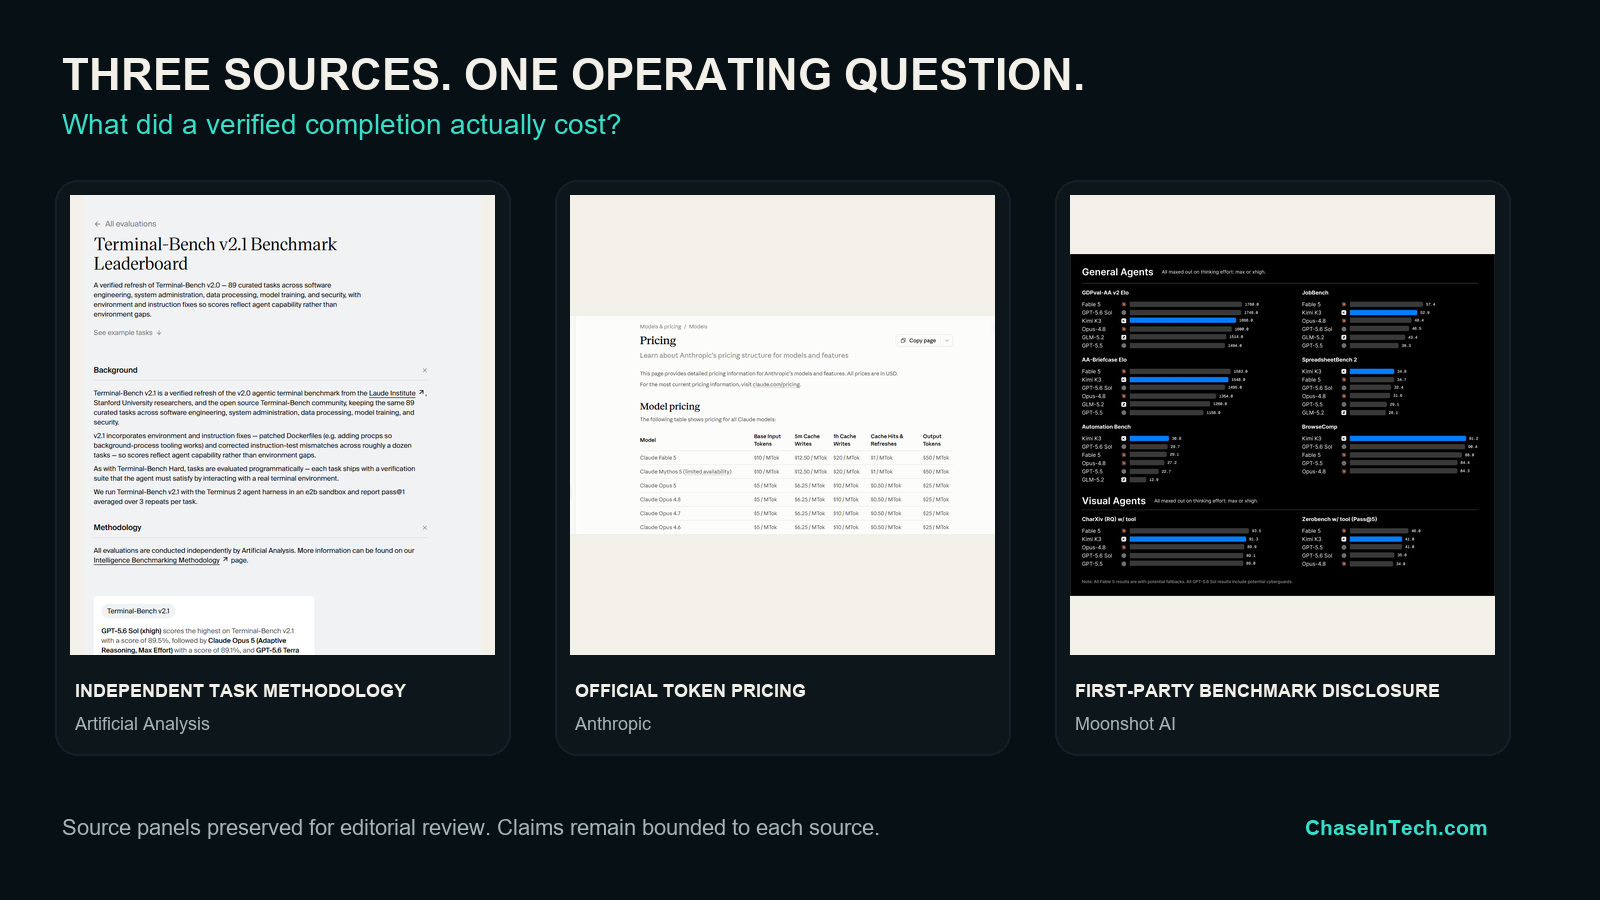
Source panels are preserved for provenance. Provider material is identified separately from independent benchmark methodology.
Sources
- FrugalGPT: https://arxiv.org/abs/2305.05176v1
- RouteLLM: https://arxiv.org/abs/2406.18665v4
- Tau-bench: https://arxiv.org/abs/2406.12045v1
- SWE-bench: https://arxiv.org/abs/2310.06770v3
- SWE-Lancer: https://arxiv.org/abs/2502.12115v4
- Measuring AI Ability to Complete Long Software Tasks: https://arxiv.org/abs/2503.14499v4
- HumanEval and Codex: https://arxiv.org/abs/2107.03374v2
- Anthropic multi-agent research system: https://www.anthropic.com/engineering/multi-agent-research-system
- OpenAI model-selection guidance: https://developers.openai.com/api/docs/guides/model-selection
- Artificial Analysis Terminal-Bench v2.1: https://artificialanalysis.ai/evaluations/terminalbench-v2-1
- Kimi K3 technical blog: https://www.kimi.com/blog/kimi-k3
- Anthropic pricing: https://platform.claude.com/docs/en/about-claude/pricing